Invest with the Trend
Systematic trendfollowing exchange traded funds, and stocks.
Saturday, May 20, 2023
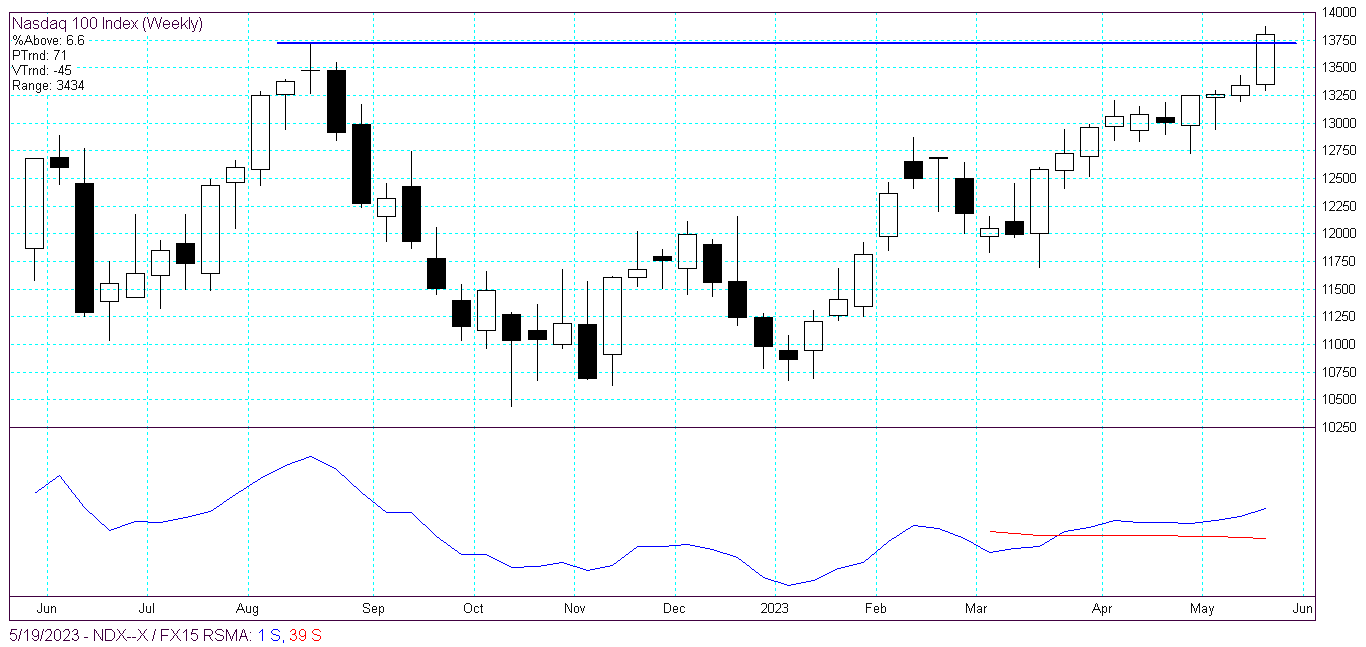
Nasdaq 100 Index (NDX) update
This is trend following. This is not a forecast and is not a prediction.
The Nasdaq 100 Index (NDX), on the weeklies, broke out and is in a volatile Uptrend. The index is trading 6.6% in excess of a 15% annualized rate of growth (CAGR), over a 39 week (3/4 of a year) relative strength moving average.
Stock chart below -
The Nasdaq 100 Index relative to the Long Term US Treasury ETF (TLT), over the 39 week relative strength
moving average, is trading 15% above. It is plain to see that money flow is pouring into private sector stocks, compared to public debt. The relative strength cross over occurred during the week of February 1st 2023.
Stock chart below, comments welcome:
Wednesday, May 10, 2023
Anheuser-Busch (BUD) versus the beer industry and the stock market
Anheuser-Busch (BUD) compared to the beer industry and the stock market
There are five major "Brewery" stocks listed on the US stock market. The 5 companies, according to The Global Industry Classification System (GICS), are listed alphabetically as follows:
| Symbol | Company Name |
|---|---|
| ABEV | AMBEV S.A |
| BUD | Anheuser-Busch In Bev SA/NV |
| SAM | Boston Beer Company Inc. |
| CCU | Compañía de las Cervecerías Unidas SA |
| TAP | Molson Coors Beverage Co |
In this post, we rank the stocks compared to Anheuser-Busch In Bev aka "Bud". Additionally, we add The S&P 500 Index ETF (SPY) and The Nasdaq 100 Index ETF (QQQ) for relative strength comparison.
The relative strength comparison metric is a 200 day moving average, where the stock price is indicated as a percentage above or below, sorted by strength. This is not a prediction and is not a forecast. The is pure trend following (see The Trend Following definition tab above), this is not fundamental analysis.
The ranking:
| Symbol | Company Name | 200 day % above/below |
|---|---|---|
| CCU | Compania Cervecerias Uni | 17.1 |
| TAP | Molson Coors Brewing Co | 10.1 |
| BUD | Anheuser-Busch InBev | 0 |
| QQQ | Nasdaq 100 Index ETF | -1.1 |
| SPY | SPDRs S&P 500 ETF | -6.3 |
| ABEV | Ambev S.A. | -8.5 |
| SAM | Boston Beer Co | -20.7 |
Thursday, April 13, 2023
S&P 500 Index $SPX update
Monday, April 3, 2023
Nasdaq 100 Index price reversals
Nasdaq 100 Index price reversals
As the Quarter closed, The Nasdaq 100 Index (NDX) has rallied approx. 36% on an annualized basis, from the closing low of November 4th, 2022. Will Rogers famously said, “Invest in inflation”.
Today intraday, the (NDX) is trading at $13,116. The immediate price reversal level to watch is $12,978. Trading above that level will help indicate the directional trend going forward. This is trend following, not forecasting or predicting. Stock chart below, comments welcome:
 |
| Nasdaq 100 Index (NDX) |
Monday, March 20, 2023
The Semiconductor Index $SOX (SOX) price level
The Semiconductor Index $SOX (SOX) price level
The SOX Index #SOX has rallied approx 27% off the Dec low. As of the close today at $3,115, it is right up against a reversal overhead at $3,134. We'll see how it reacts if it gets back up there. Stock chart below, comments welcome:
 |
| Semiconductor Index $SOX |
Monday, March 13, 2023
Gold ETF (GLD) overhead reversal
Friday, March 3, 2023
Dow Jones Industrials Index (DJI) headed back up
Dow Jones Industrials Index (DJI) next reversal area
The Dow Jones 30 Index $DJI (DJI) sell off stopped, reversed and is headed back up. The stock index has been oscillating in a range for many weeks. The next significant, long term, reversal area is at $33,357. A close over that, will provide a clue as to the strength and direction of the rally. Stock chart below, comments welcome:
 |
| Dow Jones 30 Index (DJI) |
Subscribe to:
Comments (Atom)


