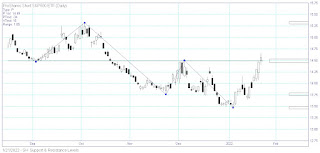
Natural Resource Partners Lp (NRP) entering buy zone
Natural Resource Partners Lp (NRP), trading in excess of 23% above The US Oil Fund ETF (USO) is trading over near term resistance. See stock chart below:
 |
| Natural Resource Partners Lp (NRP) |
Natural Resource Partners Lp (NRP), trading in excess of 23% above The US Oil Fund ETF (USO) is trading over near term resistance. See stock chart below:
|
| Natural Resource Partners Lp (NRP) |
The (TLT) ETF, on AVOID, weekly chart is holding a reversal (support and resistance) at $140.50. A weekly close below this level will suggest a continuation of selling pressure. The Real Rate of Return over a 200 day average is about –15%. See stock chart below:
 |
| 20+ year Treasury Bond ETF (TLT) |
Pdc Energy, Inc. is engaged in the exploration and and production of crude oil. Weekly chart, if it closes over $59.04, will make another 52 week high. See stock chart below:
 |
| PDC Energy (PDCE) |
 |
| Short S&P 500 Index ETF (SH) |
The Russell 2000 ETF (IWM), on Avoid, trading today at $205 continues to deteriorate, and breaks under the next long term Reversal (support and resistance) at $208.10. .see stock chart below.
Oil, and Energy stocks, Long. Gold, Treasury Bonds, Avoid... Inflation trade? Whatever is trading in excess of 20% annualized long term.
 |
| Russell 2000 Index ETF (IWM) |
Sym
|
Name
|
Trend Score % diff
|
XLE
|
SPDRs Select Sector Energy ETF
|
12.28
|
XLP
|
SPDRs Select Sector Con Staples ETF
|
1.34
|
XLF
|
SPDRs Select Sector Financial ETF
|
0.78
|
XLK
|
SPDRs Select Sector Technology ETF
|
-1.22
|
XLB
|
SPDRs Select Sector Materials ETF
|
-1.44
|
SPY
|
SPDRs S&P 500 Trust Series ETF
|
-1.86
|
XLU
|
SPDRs Select Sector Utilities ETF
|
-1.98
|
XLRE
|
Real Estate Select Sector SPDR Fund
|
-2.50
|
XLI
|
SPDRs Select Sector Industrial ETF
|
-2.70
|
XLY
|
SPDRs Select Sector Cons Disc ETF
|
-3.00
|
XLV
|
SPDRs Select Sector Health Care ETF
|
-3.10
|
XLC
|
Communication Serv Sector SPDR ETF
|
-7.92
|
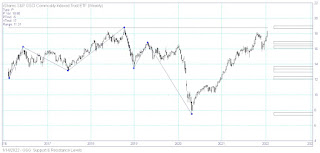 |
| S&P Commodity Index ETF (GSG) reversal point |
 |
| (GSG) relative to DB Commodity Index (DBC) |
The Nasdaq 100 Index (NDX) is leading the way down versus the S&P 500 Index (SPX). Looking at weeklies (5 day look backs), The NDX is breaking a major reversal (support and resistance) area at $15,483.
The Nasdaq 100 Index lead the way up, along with Tech, is now leading the way down. Expect a rating downgrade from Long to Neutral. See stock chart below:
The 1X Inverse Nasdaq 100 Index ETF (PSQ) is breaking out on the weekly reversals. Expect a rating upgrade Neutral to Long. from See stock chart below:
 |
| Nasdaq 100 Index (NDX) |
 |
| Inverse Nasdaq 100 Index ETF (PSQ) |
 |
| Twitter versus The S&P 500 Index |
Analyzing weekly reversals of the 20+ year Treasury Bond ETF (TLT), a significant long term pivot area is identified just below trading trading today. The TLT is trading today at $142. The pivot area (support and resistance) where a high number of reversals occur, is $141.60. Continued selling, and closing under the pivot suggests a continuation of deterioration. Interest rates continue to rise. The stock chart below shows the TLT pivot area.
 |
| Long Term Treasury Bond ETF (TLT) |
The SPDR Gold Trust (GLD) continues to under-perform, gaps down and trades under last weeks low of $167.30. The sideways chop continues. Energy stocks are stronger than gold and the stock stocks. See stock chart below:
 |
| SPDR Gold ETF (GLD) |
The S&P 500 Index $SPX #SPX, weeklys, broke out, and took out two down side reversals in December. That reversal or pivot number is $4,730. That also lines up with last weeks low of $4,734. So a take out of this price action would make the Bears grin. see stock chat below:
 |
| S&P 500 Index (SPX) |
The Ark Innovation ETF (ARKK) when compared to the SPDR Sector ETFs, on a relative strength basis, over a 200 day moving average, where the S&P 500 SPDR ETF (SPY) is the benchmark, continues to drastically underperform. Here are the numbers:
| Sym | ETF | % Diff |
| XLK | SPDRs Select Sector Technology ETF | 5.8 |
| XLY | SPDRs Select Sector Cons. Discr. ETF | 4.5 |
| XLRE | Real Estate Select Sector SPDR Fund | 3 |
| SPY | SPDRs S&P 500 Trust Series ETF | 0 |
| XLE | SPDRs Select Sector Energy ETF | -0.4 |
| XLV | SPDRs Select Sector Health Care ETF | -0.8 |
| XLP | SPDRs Select Sector Cons Staples ETF | -1.2 |
| XLU | SPDRs Select Sector Utilities ETF | -2.5 |
| XLB | SPDRs Select Sector Materials ETF | -2.8 |
| XLF | SPDRs Select Sector Financial ETF | -3.9 |
| XLI | SPDRs Select Sector Industrial ETF | -6.6 |
| XLC | Comm. Serv. Sector SPDR Fund | -9.9 |
| ARKK | ARK Innovation ETF | -23.2 |