Nasdaq 100 Index (NDX) high volatility on the Uptrend
This is trend following. This is not a forecast and is not a prediction.
The Nasdaq 100 Index (NDX), on the weeklies, broke out and is in a volatile Uptrend. The index is trading 6.6% in excess of a 15% annualized rate of growth (CAGR), over a 39 week (3/4 of a year) relative strength moving average.
Stock chart below -
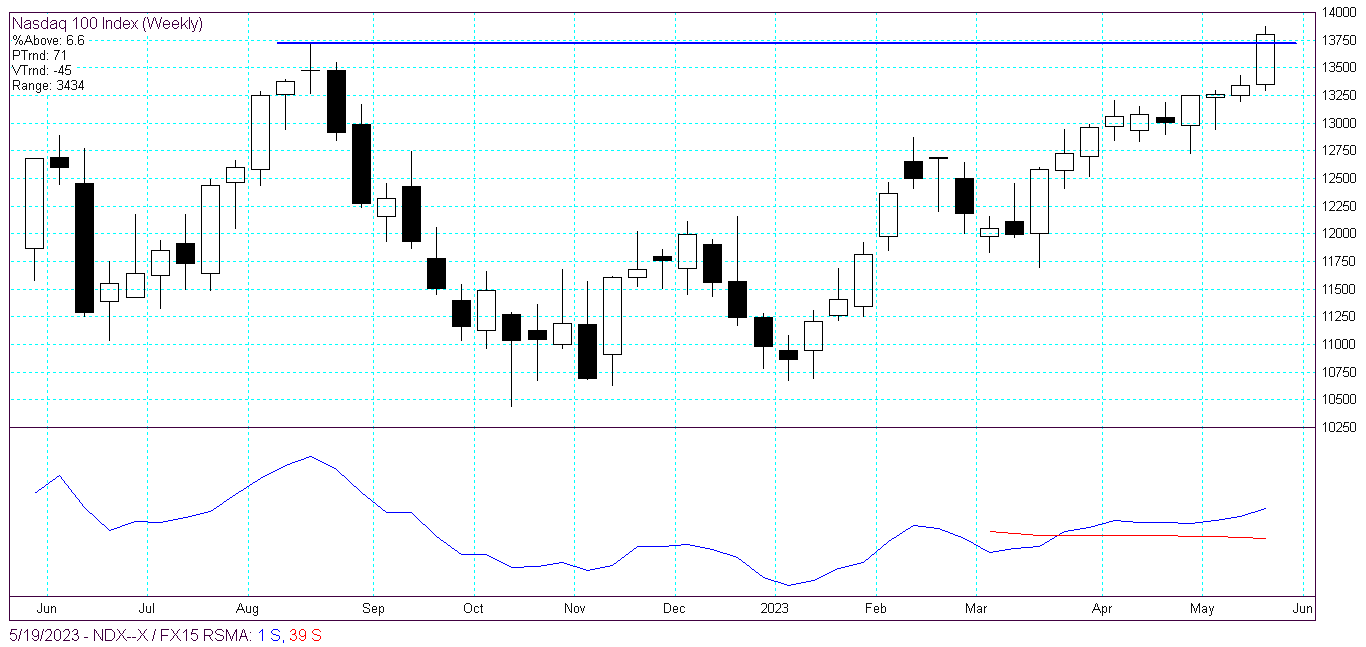 |
| Nasdaq 100 Index (NDX) |
The Nasdaq 100 Index relative to the Long Term US Treasury ETF (TLT), over the 39 week relative strength
moving average, is trading 15% above. It is plain to see that money flow is pouring into private sector stocks, compared to public debt. The relative strength cross over occurred during the week of February 1st 2023.
Stock chart below, comments welcome:
 |
| NDX relative to TLT |