Monday, January 30, 2023

S&P 500 Index (SPX) at resistance

 S&P 500 Index (SPX) at resistance

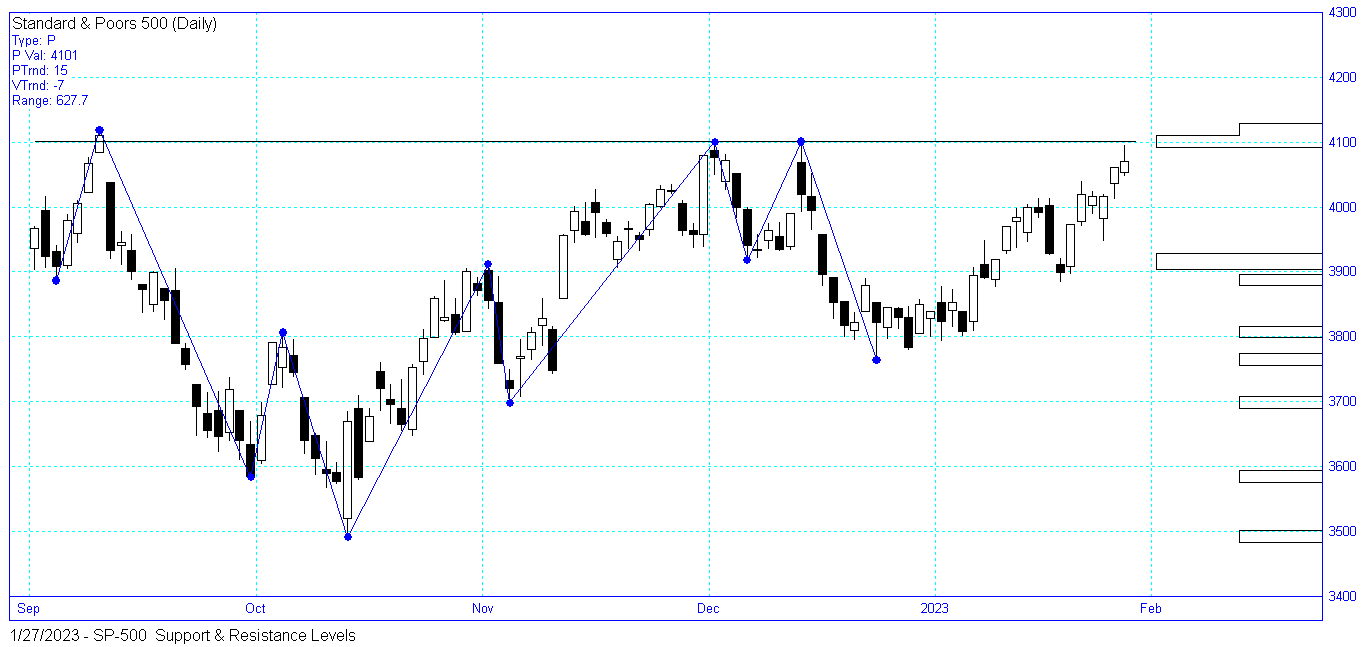
As of the close Friday Jan. 27th, the S&P 500 Index $SPX rallied up to and stopped at resistance at $4,101.
Stock chart below:

S&P 500 Index $SPX


Saturday, January 28, 2023

Pfizer Inc. (PFE) stock long term price pivot

 Pfizer (PFE) stock long term price pivot

Pfizer closed Friday at $43.79. There is a long term monthly pivot at $41.87. The pivot is composed of multiple price reversals, going back to 2018. How the stock reacts at this level will be interesting. Stock chart below, comments welcome:

Pfizer Inc. (PFE)


Tuesday, January 24, 2023

Newmont Mining (NEM) phat finger

 Newmont Mining (NEM) freak trade

Newmont Mining (NEM), the second largest market cap stock on the US listed gold miners list, apparently did a fat finger trade, a mistake human or machine, on low volume, today. So, to analyze this thing on a closing price basis, vs. the high/low, the next short term overhead reversal price is $54.35, trading today at the moment at $53.31. We are assuming the stock is not blo'd up. We'll see.

stock chart below, comments welcome:

Newmont Mining (NEM)


Saturday, January 14, 2023

Gold, the S&P 500, and global capital flows

Gold, the S&P 500, and global capital flows

Gold is most often commented on in the context of inflation. Often, what you don' t hear are comments on other items that often outperform gold, in the context of inflation, such as energy, agriculture, real estate, overseas stocks, etc. The gold coin and bar dealers don't mention these other things. Gold is a better indication of confidence. There was more confidence in the "system" last year vs. this year. The tide has turned. As to why confidence has shifted, is a big fundamental question. If the answer is as simple as money printing, the picture today would be entirely different.

At the moment, gold, overseas stock markets, and a 15% annualized return (or a 15% RRR - Real rate of Return) are outperforming the S&P 500 Index.

From the perspective of US Listed ETFs, in US Dollars, the relative strength comparisons, using a 100 day simple moving average, gold, ex USA stocks, and "inflation" (RRR) are outperforming. This is a shift from recent history. 15% Inflation, taxes, and other expenses, is a modest benchmark. Food and energy prices, year over year, are way above the the 'CPI', 

Following is a brief summary of these relative strength trend comparisons, vs. an annualized rate of return of 15%, over a 100 day moving average.

Current Trends                        % diff
Gold ETF (GLD)                        7.9
China ETF (GXC)                     14.5
Europe ETF (IEV)                     12.0
S&P 500 Index ETF (SPY)         0.4
Monday, January 2, 2023

Gold and silver stocks watchlist

Gold and silver stocks watchlist 

McEwen Mining Inc. (MUX), a gold and silver explorer, developer, producer, Market Cap $277.926M, surges to the top of the industry rally list. You can see on the table, the indicator caught the trend early on 11/07/22.
 
View the full gold and silver mining rally list here: Gold and silver mining stocks watchlist