Saturday, February 25, 2023

Pfizer Inc. (PFE) stock analysis

 Pfizer Inc. (PFE) stock analysis

Pfizer Inc. $PFE hit an all-time high back in December of 2021, at $61.71. The stock is down approx. 30% since then as of the close Friday. That is down double the S&P 500 Index.

Fridays close was $41.75. The next major price Reversal area, below is $41.15. We'll see how the stock handles that price, on a weekly or monthly close.

Stock chart below, comments welcome:

Pfizer Inc. (PFE)


Saturday, February 18, 2023

Dow Jones Industrials $DJI Stock index continues stalled

 Dow Jones Industrials $DJI Stock index continues stalled

This post is stock market trend following, not a prediction and not a forecast. Individual investors, traders, analysts, and portfolio managers can develop their own decisions.

The Dow Jones Industrials Index $DJI continues stalled, long term, at the price level of $34,397. This is determined by numerous price reversals at this level, analyzing daily data long term. Stock chart below, comments welcome.

Dow Jones 30 Index $DJI


Saturday, February 11, 2023

Dow Jones Industrials stalled

 Dow Jones Industrials $DJI stalled

This post is stock market trend following, not a prediction or forecast.

The Dow Jones Industrials Index $DJI January rally has stalled at the price level of $34,337. This is determined by numerous price reversals at this level, analyzing weekly data long term. Stock chart below, comments welcome.

Dow Jones Industrials $DJI


Sunday, February 5, 2023

S&P 500 Index (SPX) rally continues

 S&P 500 Index (SPX) rally continues

This is pure trend following. This is objective price analysis, not subjective. As freaky as domestic chaos may be, it may be more freaky elsewhere. You'll notice some of the loudest blogger bears' personal opinions out there, never mention global capital flow, as if that doesn't exist. Tip of the hat for gathering likes. Is the situation treacherous? Of course.

The rally off the October low remains intact, on a weekly and monthly basis. Weekly and monthly look backs filter out intraday and daily noise. Stock chart below, comments welcome:
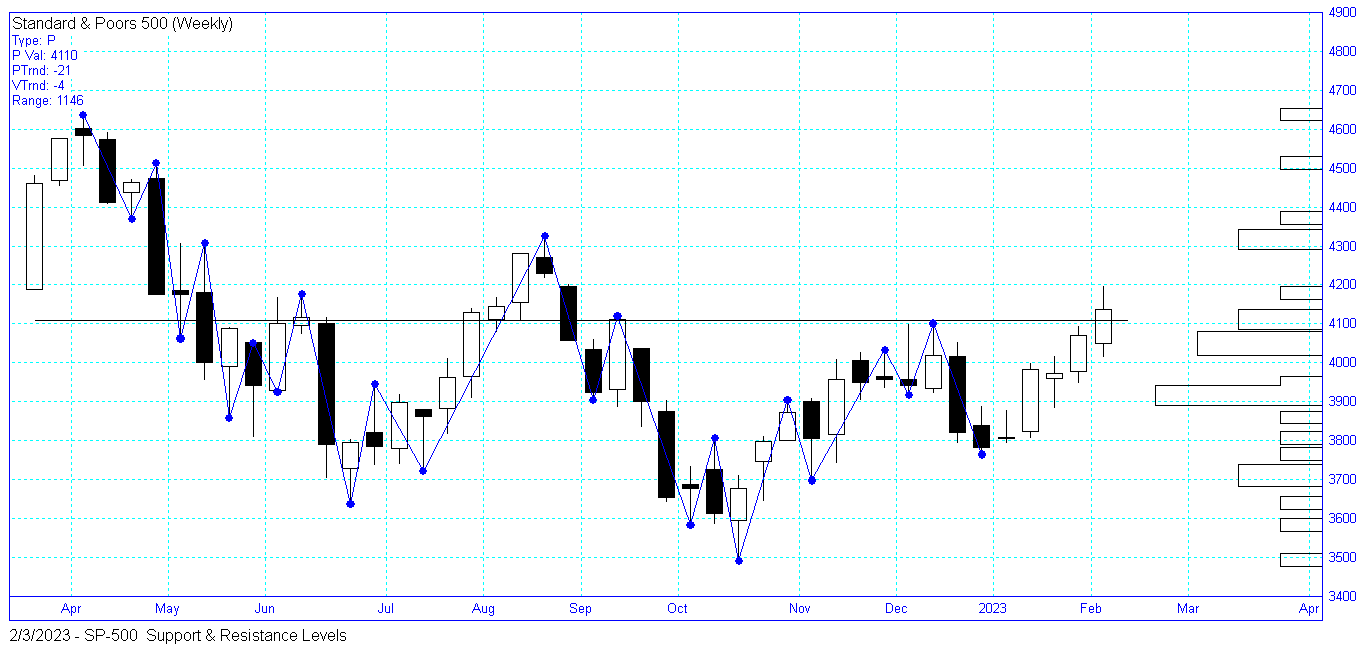
S&P 500 Index (SPX)


Wednesday, February 1, 2023

The S&P 500 Index (SPX) and Nasdaq 100 Index (NDX) breakout

The S&P 500 Index (SPX) and Nasdaq 100 Index (NDX) breakout

After the close today, Wednesday, February 1st, The S&P 500 Index $SPX (SPX), closed at $4,119.47, has broken out over longer term resistance. The previous pivot, or price level, was $4,101, as noted on the Jan. 30th post. This will encourage the trend followers (trend following), who are with the trend, and continue to frustrate the fundamental bears. Stock chart below:

S&P 500 Index $SPX (SPX)

Nasdaq 100 Index $NDX (NDX) breakout also today, stock chart below, comments welcome:

Nasdaq 100 Index $NDX (NDX)