Saturday, November 12, 2022

IAMGOLD Corporation (IAG)

IAMGOLD Corporation (IAG)

 IAMGOLD Corporation (IAG) is in the number one position at the close of the week on the trend following gold miners stock watchlist.

The buy date was October 21st on the close at $1.38. The gain is 34.06%. See stock chart below:

IAMGOLD Corporation (IAG)

Wednesday, November 9, 2022

Gold Miner stocks watchlist

 Gold Miner stocks watchlist

This post is trend following. This is not a forecast or prediction. There are no business fundamentals or economic fundamentals in this analysis.

All the gold and silver miner stocks on the list are currently on a trend following Buy signal. The signal occurs when the stock price goes from below the "Trend Quality" indicator zero line to above. Two ETFs, GDX and GDXJ, are included for comparison.

There are a total of 66 US Listed precious metals stocks. The number of stocks on Buy signal, as of 11/08/2022, is 25. The list is sorted by Watch % gain.

NameSymbolDate AddedLastWatch StartWatch %Watch Days
Coeur Mining, Inc.CDE09/29/224.323.4126.8340
Harmony Gold Mining CoHMY10/03/223.242.5825.3936
IAMGOLD CorporationIAG10/21/221.671.3821.3618
Alamos Gold Inc.AGI10/25/228.517.759.8114
Newmont CorporationNEM11/04/2244.7540.999.174
Fortuna Silver Mines Inc.FSM11/07/223.222.968.781
Agnico Eagle Mines LimitedAEM11/07/2246.4543.087.821
NovaGold Resources Inc.NG11/04/225.244.877.64
AngloGold Ashanti LimitedAU11/07/2215.9614.877.361
First Majestic Silver Corp.AG11/04/229.588.966.864
VanEck Gold Miners ETFGDX11/07/2226.8625.156.781
Comp BuenaventuraBVN11/04/227.847.376.314
Kinross Gold CorporationKGC11/07/224.133.896.171
Endeavour Silver Corp.EXK11/04/223.833.625.84
VanEck Junior Gold Miners ETFGDXJ11/07/2233.2231.465.591
Hycroft Mining Holding CorpHYMC11/04/220.780.745.414
Hecla Mining CompanyHL11/07/225.044.795.111
Wheaton Precious Metals Corp.WPM11/08/2235.7735.7700
Silvercorp Metals Inc.SVM11/08/222.742.7400
Sibanye Stillwater LimitedSBSW11/08/2210.1810.1800
New Gold Inc.NGD11/08/221.061.0600
Barrick Gold CorporationGOLD11/08/2215.6115.6100
Gold Fields LimitedGFI11/08/229.859.8500
Eldorado Gold CorporationEGO11/08/226.76.700
Yamana Gold Inc.AUY11/08/225.045.0400

Friday, September 16, 2022

Fed Ex - $FDX the economy is great

 Fed Ex gaps down

Fed Ex $FDX (FDX) gaps down 22% today. Chill, the economy is great. The last sell signal was August 24th shown on the chart below.

Fed Ex (FDX)


Saturday, June 11, 2022

Gold stocks watchlist update

Gold and Silver Mining Stocks Watchlist

June 10th, 2022. 3 gold and silver mining stocks are on LONG. Yamana Gold (AUY) is ranked at the top, however it is on a merger/acquisition agreement. 


Tuesday, June 7, 2022

Exxon Mobil Corporation

 Exxon Mobil Corporation (XOM)

Exxon Mobil (XOM) trading in excess of a 125% annualized rate of growth over a 200 day moving average. See stock chart below:

Exxon Mobil (XOM)


Sunday, May 29, 2022

Bp Prudhoe Bay Royalty Trust (BPT)

 Bp Prudhoe Bay Royalty Trust (BPT)

Prudhoe Bay Royalty Trust (BPT) is currently trading in excess of a 500% annualized rate of growth over a 200 day moving average.

See stock chart below:

Prudhoe Bay Royalty Trust (BPT)


Wednesday, May 4, 2022

LYFT (LYFT)

 LYFT should have been renamed DROP

LYFT dropped below the rate of inflation 273 days ago, Aug. 4th 2021. That's when the negative real rate of return (RRR) began. As of yesterday, according to a market blog, "sellside that as of yesterday had 26 Buys and 13 Holds", as it crashes 33% this morning. Just guessing this is still in a famed "innovation" ETF.

 Real Rate of Return stock chart below:


LYFT (LYFT)


Friday, April 29, 2022

Amazon Inc. (AMZN)

 The Amazon sell off 

Never mind multiple stop loss sell signals going back weeks and months. The stock plunged below the rate of inflation @ 15%, last November.

Amazon (AMZN)


Sunday, April 10, 2022

Saturday, April 9, 2022

Newmont Corporation

Newmont in a strong long term rally

Newmont Corp. (NEM) $NEM is in a long term rally, exceeding an annualized rate of gain in excess of 50% over a 10 month moving average.

As tech stocks collapse, and builders and banks are deconstructing, large gold miners continue to outperform. The upward volatility, over a monthly chart, is a good way to analyze the market. Stock chart below:

Newmont Corp. (NEM)


Saturday, March 26, 2022

Nutiren Ltd.

 Nutrien Ltd. the rally continues

The Nutrien Ltd. (NTR) rally continues, similar to Mosaic (MOS). Both companies are in the agriculture chemical business. 

Nutrien is trendfollowing along a 200 day moving average at a a rate of 150% annualized gain.  See stock chart below:

Nutrien (NTR)


Friday, March 25, 2022

The Mosaic Company

 Mosaic is the top trending stock in the S&P 500 Index

The Mosaic Company (MOS) is trending along at a 300% annualized rate of growth over a 200 day moving average..see stock chart below:

Mosaic (MOS)


Monday, March 7, 2022

Newmont Corporation

 Newmont Mining breakout

Newmont Corporation (NEM) a large cap gold mining company breakouts out.

Newmont (NEM) breakout


Saturday, March 5, 2022

Gold and Silver mining stocks watchlist

 Gold and silver mining stocks in a strong rally

18 gold and silver mining stocks on a strong Long term Uptrend. Included on the list is the Gold Mining ETF (GDX). The GDX makes the cut.

The trend investing, or trend following, signal is measured over four relative strength moving average time frames. The relative strength benchmark is a fixed rate of return of 20% annualized, over a 63 day, 126 day, 189 day, and 250 day moving average.

AU Anglogold Ashanti Ltd
AUY Yamana Gold Inc
BVN Compania De Minas Buena
EGO Eldorado Gold Corporation
FNV Franco Nevada Corp
GDX VanEck Vectors Gold Miners ETF
GFI Gold Fields Ltd Adr
GLDG Goldmining Inc
GOLD Barrick Gold Corp
HMY Harmony Gold Mining Co
IAG Iamgold Corp
NEM Newmont Corporation
NGD New Gold Inc
OR Osisko Gold Royalties Ltd
RGLD Royal Gold Inc
SAND Sandstorm Gold Limited
SBSW Sibanye Stillwater Ltd
SSRM SSR Mining Inc
WPM Wheaton Precious Metals Corp

Friday, March 4, 2022

Gold stocks relative strength update


Gold stocks in rally mode

Trend investing relative strength analysis - The US Listed gold and silver mining stocks, and ETFs gold, silver, gold and silver mining, S&P 500 Index long and short, and Nasdaq 100 Index long and short, and The Russell 2000 Index. The relative strength benchmark is a fixed rate of return of 20% annualized, over a 200 day moving average, sorted by % Difference.
Symbol
GFI
GLDG
BVN
SBSW
HMY
AU
SSRM
AUY
EGO
GOLD
NEM
RGLD
IAG
SAND
NGD
GDX
EQX
FNV
HL
OR
GLD
WPM
RWM
PSQ
BTG
SLV
DRD
SA
SH
AGI
PAAS
SPY
MAG
NG
MTA
EXK
QQQ
AEM
AG
IWM
GORO
FSM
SVM
AXU
KGC
NFGC
PLG
CDE
MUX
GATO
Company
Gold Fields Ltd Adr
Goldmining Inc
Compania De Minas Buena
Sibanye Stillwater Ltd
Harmony Gold Mining Co
Anglogold Ashanti Ltd
SSR Mining Inc
Yamana Gold Inc
Eldorado Gold Corporation
Barrick Gold Corp
Newmont Corporation
Royal Gold Inc
Iamgold Corp
Sandstorm Gold Limited
New Gold Inc
Gold Miners ETF
Equinox Gold Corp
Franco Nevada Corp
Hecla Mining Co
Osisko Gold Royalties Ltd
SPDR Gold Trust
Wheaton Precious Metals
Short Russell 2000
ProShares Short QQQ ETF
B2 Gold Corp
iShares Silver Trust ETF
DRD Gold Ltd Adr
Seabridge Gold Inc
Short S&P500 ETF
Alamos Gold Inc
Pan Amer Silver Cp
SPDRs S&P 500 ETF
Mag Silver Corp
Novagold Resources Inc
Metalla Royalty
Endeavour Silver Corp
Invesco QQQTrust Ser 1
Agnico Eagle Mines Ltd
First Majestic Silver Corp
Russell 2000 Index ETF
Gold Resource Corp
Fortuna Silver Mines
Silvercorp Metals In
Alexco Resource Corp
Kinross Gold Corp
New Found Gold Corp
Platinum Group Metal
Coeur Mining` Inc.
McEwen Mining Inc.
Gatos Silver Inc
% Diff
33.7
24.3
19.6
17.2
15.7
14.7
14.4
10.7
9.3
8.5
8.3
8.3
6
5.1
2.1
1.4
0.4
0.1
-0.4
-0.5
-0.7
-1.2
-1.6
-3
-3.1
-3.7
-4.6
-4.6
-7
-7.3
-8.6
-8.9
-10.9
-11.4
-13
-13.4
-13.4
-13.6
-14.7
-14.9
-16.5
-16.8
-17.5
-18.6
-19.7
-20.1
-25.5
-36.5
-38.8
-71.1


Monday, February 21, 2022

Gold and Silver Mining Stocks Watchlist


Gold and Silver Mining Stocks Watchlist update


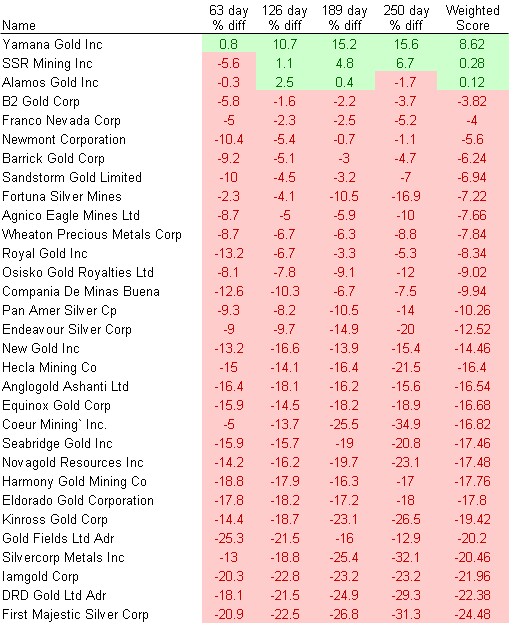
10 of the 43 gold and silver mining stocks are on LONG

Thursday, February 10, 2022

Nutrien Ltd NTR update 02-09-2022

Nutrien Ltd NTR outpacing inflation

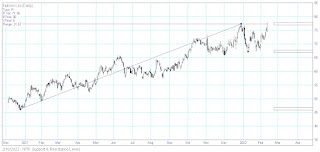
Nutrien Ltd (NTR) - Sector: Basic Materials Industry: Agricultural Inputs. Worlds largest, by market cap, fertilizer producer. Trailing Dividend Yield 2.48%. Trading in excess of 20% annualized rate of growth, over  200 day moving average, outpacing inflation. Looking to breakout today,.. or this week, we'll see what happens. Alot of these "materials" type stocks are inverse to the S&P 500 Index, lately. See stock charts below: 1) relative strength, 20% annualized rate of growth 2) resistance, break out pivot at $77.32.

Nutrien (NTR) relative strength

Nutrien (NTR) breakout pivot


Tuesday, February 8, 2022

United States Oil Fund update 02-08-2022

 United States Oil Fund pullback

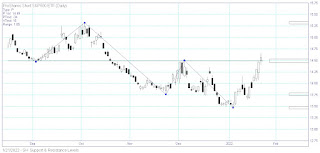
The United States Oil Fund (USO), LONG, pulls back and holds a reversal at $62.75. See stock chart below:

United States Oil Fund (USO)


Monday, February 7, 2022

Precious Metals Stock Watchlist 02-07-2022

 Precious Metals Stock Watchlist

February 07, 2022. updated, today 3 of the 41 monitored stocks  are upgraded to LONG, the rest are on AVOID.  Watchlist:

Tuesday, February 1, 2022

Today's energy stock watchlist

 trending Energy stock watch list

MUSA Murphy USA Inc ENERGY - Oil & Gas Refining & Marketing
MUR Murphy Oil Corp ENERGY - Oil & Gas Refining & Marketing
CLMT Calumet Specialty Products Partners ENERGY - Oil & Gas Refining & Marketing
AR Antero Resources Corporation ENERGY - Oil & Gas Refining & Marketing
FLNG FLEX LNG Ltd ENERGY - Oil & Gas Pipelines
ENLC EnLink Midstream LLC ENERGY - Oil & Gas Equipment & Services
DEN Denbury Inc ENERGY - Oil & Gas Equipment & Services
CDEV Centennial Resource Development Inc ENERGY - Oil & Gas Equipment & Services
NOG Northern Oil and Gas ENERGY - Oil & Gas Drilling & Exploration
MRO Marathon Oil Group ENERGY - Oil & Gas Drilling & Exploration
HPK HighPeak Energy Inc ENERGY - Oil & Gas Drilling & Exploration
ERF Enerplus Resources Fund ENERGY - Oil & Gas Drilling & Exploration
CPG Crescent Point Energy ENERGY - Oil & Gas Drilling & Exploration
LNG Cheniere Energy Inc ENERGY - Oil & Gas Drilling & Exploration
CVE Cenovus Energy Incorporated ENERGY - Oil & Gas Drilling & Exploration
CRC California Resources Corporation ENERGY - Oil & Gas Drilling & Exploration
OVV Ovintiv Inc ENERGY - Major Integrated Oil & Gas
OXY Occidental Petro Cp ENERGY - Major Integrated Oil & Gas
COP ConocoPhillips ENERGY - Major Integrated Oil & Gas
EGY Vaalco Energy Inc ENERGY - Independent Oil & Gas
PXD Pioneer Natural Rescs Co ENERGY - Independent Oil & Gas
PBT Permian Basin Royalty Tr ENERGY - Independent Oil & Gas
PDCE PDC Energy` Inc. ENERGY - Independent Oil & Gas
NFG National Fuel Gas Co ENERGY - Independent Oil & Gas
MTDR Matador Resources Company ENERGY - Independent Oil & Gas
KRP Kimbell Royalty Partners ENERGY - Independent Oil & Gas
FANG Diamondback Energy` Inc. ENERGY - Independent Oil & Gas
DVN Devon Energy Corp ENERGY - Independent Oil & Gas
CLR Continental Resources Inc ENERGY - Independent Oil & Gas
CRK Comstock Resources Inc ENERGY - Independent Oil & Gas
CIVI Civitas Resources Inc ENERGY - Independent Oil & Gas
CNQ Canadian Natural Res Ltd ENERGY - Independent Oil & Gas
BRY Berry Corp ENERGY - Independent Oil & Gas
APA APA Corporation ENERGY - Independent Oil & Gas


Monday, January 31, 2022

Natural Resource Partners Lp (NRP) update 01-31-2022

 Natural Resource Partners Lp (NRP) entering buy zone

Natural Resource Partners Lp (NRP), trading in excess of 23% above The US Oil Fund ETF (USO) is trading over near term resistance. See stock chart below:

Natural Resource Partners Lp (NRP) 


Friday, January 28, 2022

20+ Year Treasury Bond ETF update 01-28-2022

20+ Year Treasury Bond ETF holding support

The (TLT) ETF, on AVOID, weekly chart is holding a reversal (support and resistance) at $140.50. A weekly close below this level will suggest a continuation of selling pressure. The Real Rate of Return over a 200 day average is about –15%. See stock chart below: 

20+ year Treasury Bond ETF (TLT)


Pdc Energy, Inc. update 01-27-2022

 Pdc Energy, Inc. (PDCE) looking at another new 52 week high

Pdc Energy, Inc. is engaged in the exploration and and production of crude oil. Weekly chart, if it closes over $59.04, will make another 52 week high. See stock chart below:

PDC Energy (PDCE)


Friday, January 21, 2022

Short S&P 500 Index ETF update 01-21-2022

Short S&P 500 Index ETF update

The Short S&P 500 Index (SH), LONG, has come off a bottom and is trading today over the December reversal. The reversal is $14.49.  ..see stock chart below:
Short S&P 500 Index ETF (SH)


Wednesday, January 19, 2022

Russell 2000 ETF update 01-19-2022

Russell 2000 small cap stock ETF breaks support again

The Russell 2000 ETF (IWM), on Avoid, trading today at $205 continues to deteriorate, and breaks under the next long term Reversal (support and resistance) at $208.10. .see stock chart below.

Oil, and Energy stocks, Long. Gold, Treasury Bonds, Avoid... Inflation trade? Whatever is trading in excess of 20% annualized long term.

Russell 2000 Index ETF (IWM)


Tuesday, January 18, 2022

SPDR Sector ETF watchlist update 01-17-2022

Energy stocks are the strongest performing sector

The watchlist ranks The SPDR Sector ETFs by pure momentum trendfollowing. Each ETF is analyzed for trend momentum. The analysis measures trend strength, benchmarked at a 20% annualized growth rate, over four time frames: 63 days, 126 days, 189 days, 250 days. The trends are indexed with added weight on the 63 day time frame, to produce the Trend Score. A positive Trend Score, is trending in excess of 20% annualized. The S&P 500 Index SPDR ETF (SPY) is added to the watchlist for relative strength performance comparison. 

Sym
Name
Trend Score % diff
XLE
SPDRs Select Sector Energy ETF
12.28
XLP
SPDRs Select Sector Con Staples ETF
1.34
XLF
SPDRs Select Sector Financial ETF
0.78
XLK
SPDRs Select Sector Technology ETF
-1.22
XLB
SPDRs Select Sector Materials ETF
-1.44
SPY
SPDRs S&P 500 Trust Series ETF
-1.86
XLU
SPDRs Select Sector Utilities ETF
-1.98
XLRE
Real Estate Select Sector SPDR Fund
-2.50
XLI
SPDRs Select Sector Industrial ETF
-2.70
XLY
SPDRs Select Sector Cons Disc ETF
-3.00
XLV
SPDRs Select Sector Health Care ETF
-3.10
XLC
Communication Serv Sector SPDR ETF
-7.92

Saturday, January 15, 2022

S&P Commodity Index ETF rallying for higher highs

 S&P Commodity Index ETF gunning for higher highs

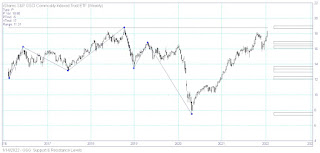
The S&P Commodity Index ETF (GSG) $GSG is rallying for higher highs. The next major high, or reversal point, is the high back in 2018 at $18.80.   ..see stock chart below:

The (GSG) is trading 1.2% above, over a 200 day moving average, The DB Commodity Index ETF (DBC). ..see stock chart below:

S&P Commodity Index ETF (GSG) reversal point

(GSG) relative to DB Commodity Index (DBC)


Monday, January 10, 2022

Nasdaq 100 Index update 01-10-2022

The Nasdaq 100 Index (NDX) is leading the way down versus the S&P 500 Index (SPX). Looking at weeklies (5 day look backs), The NDX is breaking a major reversal (support and resistance) area at $15,483.

The Nasdaq 100 Index lead the way up, along with Tech, is now leading the way down. Expect a rating downgrade from Long to Neutral. See stock chart below:

The 1X Inverse Nasdaq 100 Index ETF (PSQ) is breaking out on the weekly reversals. Expect a rating upgrade Neutral to Long. from See stock chart below:

Nasdaq 100 Index (NDX)

Inverse Nasdaq 100 Index ETF (PSQ)


Saturday, January 8, 2022

Twitter vs. The S&P 500 Index 01-07-2021

Twitter is way below the S&P 500 Index 

Twitter, Inc. stock (TWTR) $TWTR compared to The S&P 500 Index (SPX) $SPX, using a 200 day relative strength moving average, is underperforming by 37%. See stock chart below:
Twitter versus The S&P 500 Index


Friday, January 7, 2022

Long Term US Treasuries 01-07-2022

Long term treasuries deteriorating

Analyzing weekly reversals of the 20+ year Treasury Bond ETF (TLT), a significant long term pivot area is identified just below trading trading today. The TLT is trading today at $142. The pivot area (support and resistance) where a high number of reversals occur, is $141.60. Continued selling, and closing under the pivot suggests a continuation of deterioration. Interest rates continue to rise. The stock chart below shows the TLT pivot area.


Long Term Treasury Bond ETF (TLT)


Thursday, January 6, 2022

SPDR Gold Trust 01-06-2022

 SPDR Gold Trust breaks support

The SPDR Gold Trust (GLD) continues to under-perform, gaps down and trades under last weeks low of $167.30. The sideways chop continues. Energy stocks are stronger than gold and the stock stocks. See stock chart below:

SPDR Gold ETF (GLD)


Tuesday, January 4, 2022

S&P 500 Index 01-04-2022

 S&P 500 Index is holding the breakout

The S&P 500 Index $SPX #SPX, weeklys, broke out, and took out two down side reversals in December. That reversal or pivot number is $4,730. That also lines up with last weeks low of $4,734. So a take out of this price action would make the Bears grin. see stock chat below:

S&P 500 Index (SPX)


Monday, January 3, 2022

Ark Innovation ETF vs. The S&P SPY ETF

The Ark Innovation ETF continues to way underperform

The Ark Innovation ETF (ARKK) when compared to the SPDR Sector ETFs, on a relative strength basis, over a 200 day moving average, where the S&P 500 SPDR ETF (SPY) is the benchmark, continues to drastically underperform. Here are the numbers:

Sym ETF % Diff
XLK SPDRs Select Sector Technology ETF 5.8
XLY SPDRs Select Sector Cons. Discr. ETF 4.5
XLRE Real Estate Select Sector SPDR Fund 3
SPY SPDRs S&P 500 Trust Series ETF 0
XLE SPDRs Select Sector Energy ETF -0.4
XLV SPDRs Select Sector Health Care ETF -0.8
XLP SPDRs Select Sector Cons Staples ETF -1.2
XLU SPDRs Select Sector Utilities ETF -2.5
XLB SPDRs Select Sector Materials ETF -2.8
XLF SPDRs Select Sector Financial ETF -3.9
XLI SPDRs Select Sector Industrial ETF -6.6
XLC Comm. Serv. Sector SPDR Fund -9.9
ARKK ARK Innovation ETF -23.2